Introduction
We already know that Lean Six Sigma is about addressing strategic gaps to become more competitive. So, within our organisations, assuming we have a need to improve, there are then two key questions that need answering:
- Is there an opportunity to improve existing process performance?
- What business benefit will it give us financially to do so?
If we need to improve our organisations process performance, we will either need to do it because we want to become more efficient by using our resources better, or more effective in satisfying customers, or indeed both. The common driver behind both of these is ultimately to improve financial results, for example reducing resources reduces costs and creates additional capacity that can lead to additional revenue. Improving customer satisfaction reduces the cost of complaints, reduces the risk of losing revenue, and may generate additional revenue.
If we don’t understand the links between process performance and financial performance we risk improving things that don’t give us a return on investment, for example we might take waiting time (waste) out of a process only to find that it makes no difference financially because the process is not the slowest part of the operation. Or, we could reduce customer complaints by spending a whole lot more than the complaint really cost us in the first place.
To make best use of our improvement effort, we must understand not only the opportunity, but also the financial business benefit it will bring.
Measuring Process Performance
In previous articles, we have discussed the five universal performance factors that can be used to measure process performance; these are quality, delivery, cost, flexibility and responsiveness.

· Quality is producing the goods error free and in line with customer requirements. It means ensuring customer satisfaction.
· Delivery is providing product or service to the customer when it has been promised.
· Cost is the value of the transformation resources used during the process.
· Flexibility is the ability of the operation to respond to when customer requirements change.
· Responsiveness is how fast the operation is able to respond to customer requests for product or service
Let’s firstly consider resources. All processes consume resources; the resources consumed will vary depending on the process involved, but may include people, equipment, utilities and space. Most resources cost money. An efficient process will consume the minimum amount of resources required to transform inputs to outputs and therefore operate at lowest cost.
An effective process will satisfy the customer of the process. Customers will judge the quality or adherence to requirements of the product, and whether it was delivered in the agreed time. The customer will also judge the price they pay.
If the customer judges that the value they receive from the quality/delivery/price combination is satisfactory then they will remain a customer and generate revenue for the organisation, and if the process is able to produce at a lower price than the customer pays, then there is a sustainable system. If the customer judges that the value is not satisfactory they will not remain a customer and revenue will reduce. If the process operating cost is higher than the price, then the system is not sustainable.
Understanding Financial Performance
To consider the relationship between process performance and financial performance let’s take a look at a theoretical business. Here is a simple operation that is producing a product, but it could just as easily be a service. The process has Goods Inwards (with inspection), 2 main processing steps (P1 and P2) with associated test points (T1 and TF), and each product/service is then shipped.

If we consider what costs will be incurred within this process, we will come up with items such as labour, material, shipping, power, advertising and so on.
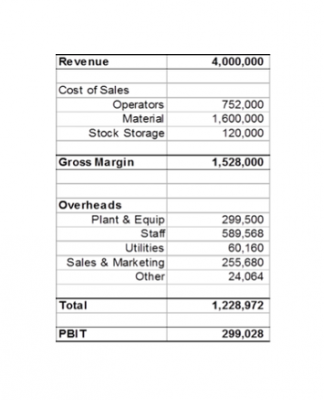
Finance will take these costs, compare them with the revenue generated, and prepare a Profit and Loss account that may look something like the table below.

The figures shown assume sales of 40,000 items at £10 each, paying employees a reasonable salary, buying materials, using equipment and so on.
We can see that the bottom line is a PBIT (Profit Before Interest and Taxation) of just over £299,000, but is this good? The answer is it depends on what kind of business we are in, but PBIT is not really a good indicator of whether the organisation is performing as it should or not. A better measure is Return on Capital employed, or ROCE, as this measures how much return is produced for each pound, dollar, euro or whatever unit of currency is invested. Let us assume that 3 million has been invested, making the ROCE about 10%. If you had invested this personally what return would you want? In today’s economic climate most people would say that 10% was a reasonable, but not amazing return.
Linking Process and Financial Performance
To understand the relationship further, let’s firstly introduce a concept called Rolled Throughput Yield, or RTY. The Yield (YN) for a step in a process is the probability that a unit will get through that step right first time. The probability that the unit will get through all the steps in the process is called Rolled Throughput Yield. If we know the yield for each process step, we can calculate RTY using the following formula:
RTY = Y1 x Y2 x Y3 …x YN where YN is the yield at step N.
RTY is a better indication of overall process performance than final test yield, which is an often quoted operational statistic. Final test yield takes no account of problems during the process and does not reflect the real difficulty of processing units through the operation. We can also use RTY to help calculate some performance statistics for the process overall. Assume that any unit that does not get through right first time requires rework, and rework costs us 2 units of currency. The amount of units requiring rework is 1-RTY. If 100,000 units are processed in total, then the rework cost is 2 x 100,000 x (1-RTY). If RTY is 89%, and the process loss can be calculated as follows:
Process loss = 2 x 100,000 x (1-.89)
= 22,000
However, that’s not the end of the story; consider the impact on lead time of the rework. Let’s assume that the normal lead time is 3.5 hours for good units, and that it takes 48 hours to process the rework. We can calculate the average lead time by considering the proportion of parts that are processed in each way as follows:
Overall Cycle time = (RTY * RFT cycle time) + ((1-RTY) * Rework cycle time))
= (.89 * 3.5) + ((1-.89) * 48))
= 8.395 hours
So, it is taking us twice as long to process our batch of 100,000 units as we expected.
The impact is not only on lead time, consider the impact on stock in the process. If it is taking us 8.395 hours to process instead of 3.5 hours, the amount of work in progress (WIP) in the system will be increased pro-rata. So, assuming we allow for a theoretical WIP amount of 200,000 units, the true level of WIP will be as follows:
WIP true = WIP theoretical x actual time
theoretical time
= 200,000 x 8.395
3.5
= 479,714
Many organisations will assume a holding cost for stock, to take into account the capital required to fund it, the space required to hold it and the manpower needed to manage it. This cost is expressed as a percentage of the stock value, and can be as high as 20%. Assuming our units have a stock value of 2 units each and a stock holding cost of 20%, that’s an additional stock holding cost of 118,885 units of currency.
Alternatively, we could decide to purchase additional units and accept that some units require rework and will not be shipped on time with the rest. The additional units we need to purchase can be calculated as follows:
Additional units = ( 1 – 1) * 200,000
RTY
= .1235 * 200,000
= 24,700
The process loss will be the cost of purchase of the additional units, and again a stock holding cost.
If we assume the units are not being reworked, but instead are scrapped, then the loss will be the cost of purchasing replacement units.
Other costs that could be incurred could include:
• Warranty costs
• Additional shipping costs
• Lost customer business
Hidden Costs of Quality
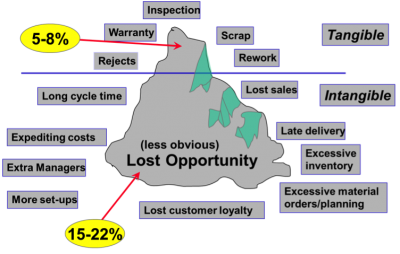
The other scary thing is that the costs quoted in the previous exercise are in most organisations only the tip of the iceberg, there are many other costs that are hidden. Many of these extra costs originate with poor ‘right first time’ rates, but lead to extra cost related to effectiveness and efficiency issues, for example the time and cost involved at management level in dealing with expediting orders because of delays, or the time and costs associated with dealing with customer complaints. Many of these costs are not immediate, they can be considered, however, by means of the COQ model. The Cost of Quality estimates that 15-30% of Cost of Sales (COS) is actually Cost of Quality. Much of this cost, if reduced, will flow direct to the “bottom line” or profit for the organisation. Studies have shown that the visible cost of quality is typically only around one quarter of the true cost, the rest is hidden.

Cost of quality splits costs into four categories, Prevention, Appraisal, Internal Failure and External Failure, and there are defined items in each category.
There are two ways of producing Cost of Quality data within an organisation. The first is to modify the existing accounts structure to start picking up these costs and allocating them to the different elements of COQ. The second is to estimate the costs based on a short period of additional data collection, then produce an overall figure. The principle is to produce a benchmark that shows how large the cost actually is. Many organisations dramatically underestimate their true Cost of Quality.
Summary
Having established that process performance links directly to financial performance, and the fact that hidden costs can multiply the visible cost by a factor of at least 4, we can see that process improvement is directly linked to organisation profit, and in turn return in invested capital.
Lean Six Sigma methods can be used to improve process performance, whether this is generating additional revenue, reducing process cost or improving customer satisfaction, but prior to commencing improvement activity, it is essential to estimate the impact this will have on organisation financials such as PBIT and ROCE. This is best done by working in conjunction with the Finance areas within the organisation at the start of any potential project to establish what financial benefit will accrue from any performance improvement. The wrong time to have a discussion on what the savings are for a project is at the end!